CropMap Advantage in the Cotton Market
Cotton is a key agricultural commodity for many developing countries around the world. However, global cotton production faces several challenges, with natural disasters significantly impacting output in leading producer countries. Türkiye stands out as a strong player in this sector, although cotton cultivation has declined in certain regions as of 2023. Agricultural intelligence technologies like CropMap collect and analyze cotton production data, helping policymakers make informed decisions while also improving the accuracy of crop classification.

Global Cotton Production
Cotton production is a highly valuable sector that supports a population of approximately 250 million people and accounts for around 7% of the workforce in developing countries. Despite the emergence of modern synthetic fibers, cotton remains widely used in textiles due to its moisture absorption, durability, and comfort. Cotton fibers are derived from the seed coat of the cotton plant, and the process involves separating the seeds and extracting the fibers for textile use.¹
Global Cotton Production Outlook: Where Is Cotton Grown?
According to the OECD, global cotton production is expected to grow at an annual rate of 1.5% and reach 28 million tons by 2030.² However, in 2022, only modest increases were observed in major producers such as China and India. Severe flooding in Pakistan led to a 38% decline in production, while drought conditions in the United States resulted in one of the worst harvests of the past decade.³
The Cotton Association of India (CAI) projected that India’s 2022–23 cotton production would reach its lowest level in 14 years and fall below domestic consumption for the second consecutive year due to reduced yields.⁴
Türkiye’s Cotton Industry
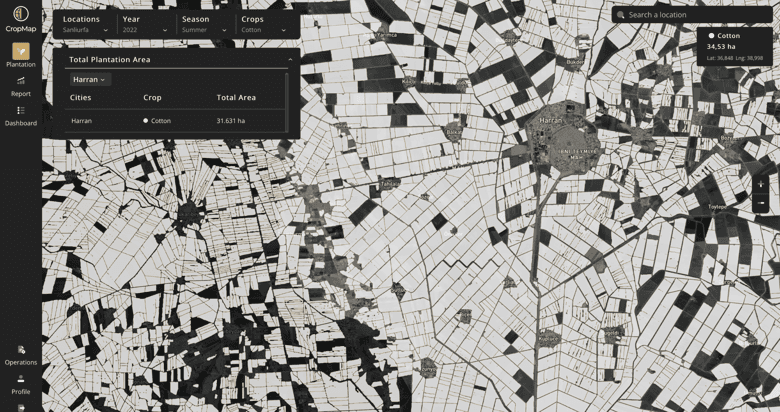
Türkiye stands out as one of the world’s top 10 cotton producers. According to CropMap’s latest data from 2022, the country has a total of 526,960 hectares of cotton fields.
Cotton cultivation is concentrated in nine key provinces—Adana, Adıyaman, Aydın, Denizli, Diyarbakır, Manisa, Mardin, Muğla, and Şanlıurfa—which together account for 80% of national production (CropMap data).
As of late 2023, the cotton planting season has begun. However, a notable trend is that planting activity in these nine major provinces has decreased by 19.5% compared to the same period in 2022. This shift signals a landscape that requires close monitoring within Türkiye’s cotton industry.
Revolutionizing Crop Classification with CropMap
In an evolving agricultural sector, precision is critical. The ability to accurately classify and monitor crops directly impacts resource allocation and decision-making, ultimately improving productivity. Traditional crop classification methods often face challenges in accuracy and efficiency, especially at large commercial scales.
CropMap addresses these challenges by combining remote sensing, machine learning, and high-quality ground-truth data. This advanced approach overcomes many limitations of existing solutions in the field.
In 2023, significant milestones were achieved, supported by 3.5 billion lines of code and more than 8,500 field samples, including 1,900 related to cotton.
Challenges in Cotton Classification
One of the main challenges in cotton monitoring is accurately estimating total planted area. This becomes particularly difficult in regions where farmers plant cotton outside the official season due to climate variability.
In such cases, reliable data can only be obtained once crops reach specific phenological stages detectable through remote sensing. Even small decreases in accuracy across large areas can lead to significant deviations in total planting estimates, making precision essential for commercial applications.
Agricultural Market Intelligence with CropMap
CropMap provides agricultural intelligence that supports in-season operations and helps optimize logistics and supply chain decisions. As crop data accumulates over time, historical trends become visible, enabling customers to make more accurate price forecasts for future seasons. Global planted area is a key input for price forecasting, and CropMap serves as a strategic partner in accessing this critical information.
Managing Cotton Price Volatility
The cotton market has historically been subject to price volatility driven by external shocks. Much of this uncertainty stems from economic growth and urbanization trends in developing countries, which directly influence cotton demand. Additionally, cotton production is highly sensitive to pests and weather conditions. When combined with the potential impacts of climate change, these factors further increase uncertainty.
The OECD projects that, in the long term, international cotton prices will decline due to competition from synthetic fibers, particularly polyester. Although real prices are expected to decrease, nominal prices may still show slight increases. This trend has been observed since the 1970s, when polyester began competing with cotton on cost.⁵
Global Cotton Prices
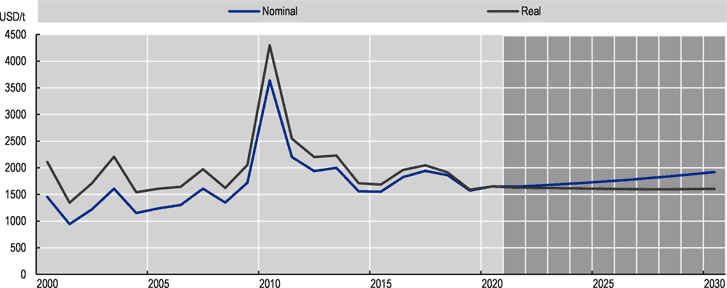
Source: OECD/FAO (2021), OECD-FAO Agricultural Outlook 2021–2030, https://doi.org/10.1787/agr-outl-data-en.
Advanced agricultural technologies are essential for reducing risks and increasing production in a dynamic and uncertain agricultural market. Tools like CropMap provide valuable insights into historical planting trends and pricing, enabling public institutions to design informed policies. These insights support strategic decisions such as strengthening cotton production or encouraging transitions to alternative cash crops. In a rapidly changing agricultural landscape, solutions like CropMap have become indispensable. By leveraging the power of technology and data, stakeholders can navigate the complexities of agriculture with greater confidence and precision. CropMap is not just a tool—it is a strategic advantage for the evolving agricultural industry.
Sources
Global Cotton Production
Cotton production is a highly valuable sector that supports a population of approximately 250 million people and accounts for around 7% of the workforce in developing countries. Despite the emergence of modern synthetic fibers, cotton remains widely used in textiles due to its moisture absorption, durability, and comfort. Cotton fibers are derived from the seed coat of the cotton plant, and the process involves separating the seeds and extracting the fibers for textile use.¹
Global Cotton Production Outlook: Where Is Cotton Grown?
According to the OECD, global cotton production is expected to grow at an annual rate of 1.5% and reach 28 million tons by 2030.² However, in 2022, only modest increases were observed in major producers such as China and India. Severe flooding in Pakistan led to a 38% decline in production, while drought conditions in the United States resulted in one of the worst harvests of the past decade.³
The Cotton Association of India (CAI) projected that India’s 2022–23 cotton production would reach its lowest level in 14 years and fall below domestic consumption for the second consecutive year due to reduced yields.⁴
Türkiye’s Cotton Industry
Türkiye stands out as one of the world’s top 10 cotton producers. According to CropMap’s latest data from 2022, the country has a total of 526,960 hectares of cotton fields.
Cotton cultivation is concentrated in nine key provinces—Adana, Adıyaman, Aydın, Denizli, Diyarbakır, Manisa, Mardin, Muğla, and Şanlıurfa—which together account for 80% of national production (CropMap data).
As of late 2023, the cotton planting season has begun. However, a notable trend is that planting activity in these nine major provinces has decreased by 19.5% compared to the same period in 2022. This shift signals a landscape that requires close monitoring within Türkiye’s cotton industry.
Revolutionizing Crop Classification with CropMap
In an evolving agricultural sector, precision is critical. The ability to accurately classify and monitor crops directly impacts resource allocation and decision-making, ultimately improving productivity. Traditional crop classification methods often face challenges in accuracy and efficiency, especially at large commercial scales.
CropMap addresses these challenges by combining remote sensing, machine learning, and high-quality ground-truth data. This advanced approach overcomes many limitations of existing solutions in the field.
In 2023, significant milestones were achieved, supported by 3.5 billion lines of code and more than 8,500 field samples, including 1,900 related to cotton.
Challenges in Cotton Classification
One of the main challenges in cotton monitoring is accurately estimating total planted area. This becomes particularly difficult in regions where farmers plant cotton outside the official season due to climate variability.
In such cases, reliable data can only be obtained once crops reach specific phenological stages detectable through remote sensing. Even small decreases in accuracy across large areas can lead to significant deviations in total planting estimates, making precision essential for commercial applications.
Agricultural Market Intelligence with CropMap
CropMap provides agricultural intelligence that supports in-season operations and helps optimize logistics and supply chain decisions. As crop data accumulates over time, historical trends become visible, enabling customers to make more accurate price forecasts for future seasons. Global planted area is a key input for price forecasting, and CropMap serves as a strategic partner in accessing this critical information.
Managing Cotton Price Volatility
The cotton market has historically been subject to price volatility driven by external shocks. Much of this uncertainty stems from economic growth and urbanization trends in developing countries, which directly influence cotton demand. Additionally, cotton production is highly sensitive to pests and weather conditions. When combined with the potential impacts of climate change, these factors further increase uncertainty.
The OECD projects that, in the long term, international cotton prices will decline due to competition from synthetic fibers, particularly polyester. Although real prices are expected to decrease, nominal prices may still show slight increases. This trend has been observed since the 1970s, when polyester began competing with cotton on cost.⁵
Global Cotton Prices
Source: OECD/FAO (2021), OECD-FAO Agricultural Outlook 2021–2030, https://doi.org/10.1787/agr-outl-data-en.
Advanced agricultural technologies are essential for reducing risks and increasing production in a dynamic and uncertain agricultural market. Tools like CropMap provide valuable insights into historical planting trends and pricing, enabling public institutions to design informed policies. These insights support strategic decisions such as strengthening cotton production or encouraging transitions to alternative cash crops. In a rapidly changing agricultural landscape, solutions like CropMap have become indispensable. By leveraging the power of technology and data, stakeholders can navigate the complexities of agriculture with greater confidence and precision. CropMap is not just a tool—it is a strategic advantage for the evolving agricultural industry.


