How to Read NDVI Maps: Growth Stages & Possible Color Indications
Although NDVI maps have been crucial in following crop health and growth, reading them and turning colors into meaningful insight might be challenging. We have prepared this guide to protect our readers from falling into general misconceptions. Rather than generalizing that green is healthy and red is alarming, one should pay attention to the timeline between sowing/planting and harvesting while reading NDVI maps.

Normalized Difference Vegetation Index (NDVI) is a crucial tool for analyzing plant health and optimizing agricultural productivity. Utilized globally across various agricultural applications, NDVI maps help farmers and agronomists monitor crop health, manage resources more efficiently, and enhance crop yields. By measuring and comparing the reflectance of near-infrared light, which healthy plants strongly reflect, against visible red light, which they absorb, NDVI provides a clear indicator of vegetation vigor and health.
In the realm of digital agriculture, Doktar leverages NDVI technology extensively through its innovative products, such as the Doktar App field scouting app and FieldFlow Farm Management System. These platforms use NDVI to identify areas of stress in crops, monitor growth stages, and optimize inputs like water and fertilizers, thereby supporting farmers in making data-driven decisions that lead to more sustainable farming practices and improved crop management.
Although NDVI maps have been crucial in following crop health and growth, reading them and turning colors into meaningful insight might be challenging. We have prepared this guide to protect our readers from falling into general misconceptions. Rather than generalizing that green is healthy and red is alarming, one should pay attention to the timeline between sowing/planting and harvesting while reading NDVI maps.
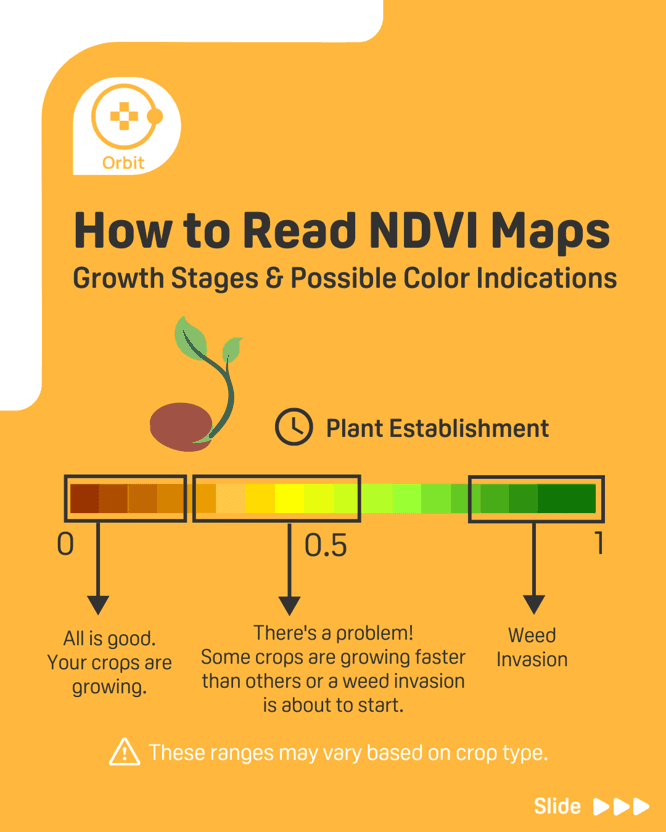
Plant establishment
In the early stage of plant establishment, successful germination and seedling survival are critical for the healthy development of crops. During this period, plants are particularly vulnerable and require optimal soil conditions, which can be closely monitored using NDVI maps. These maps provide valuable insights into the uniformity of plant emergence across a field, highlighting areas where growth may be uneven or delayed due to issues like soil compaction, moisture inconsistencies, or nutrient deficiencies.
To enhance the understanding of plant establishment through NDVI readings, it's important to observe the color gradients that indicate varying levels of plant health. For this period, the ideal expectation is a transition from red to yellow with an NDVI value closer to zero. Given that these are the early days for a crop to grow, high NDVI values may indicate either unbalanced growth between crops or weed invasion that is about to start or has already started. Addressing these discrepancies early on, by adjusting irrigation practices or redistributing nutrients, can lead to more uniform growth and ultimately, a more successful crop yield. This stage of analysis not only guides immediate agricultural interventions but also informs future preparatory measures for planting seasons.
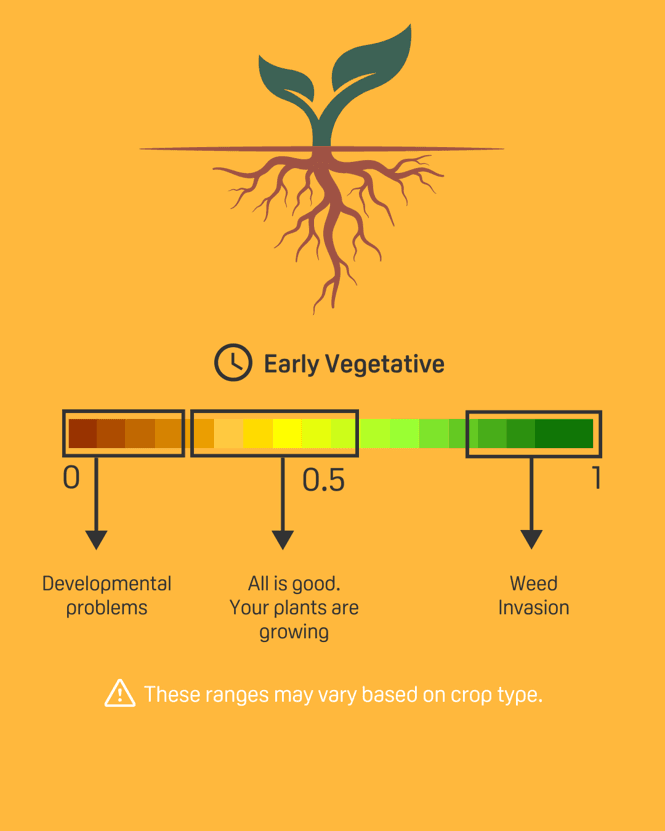
Early Vegetative
During the early vegetative stage, plants begin to develop their first true leaves and start photosynthesis, which is crucial for their growth and development. This phase is critical as the plants are establishing their root systems and beginning to actively compete for light, nutrients, and water. NDVI maps are particularly useful in this stage for monitoring plant vigor and ensuring that the young crops are developing uniformly across the field.
The significance of NDVI during the early vegetative stage lies in its ability to provide a clear, visual representation of plant health and biomass accumulation. Tones from dark yellow to light green are the desirable ones on the map. While color tones closer to red (tones closer to value zero) might indicate developmental problems due to moisture, nutrient deficiencies, or disease, higher NDVI values (ranging towards one) indicating a more intense green color on the map might indicate weed invasion.
By using NDVI maps during the early vegetative stage, farmers and agronomists can make informed decisions about where to focus their efforts, whether it is to adjust irrigation systems, apply fertilizers, or implement pest and disease control measures. This targeted management helps in optimizing resource use and improving the overall efficiency of agricultural operations, setting the stage for robust plant growth and increased yield potential as the season progresses.
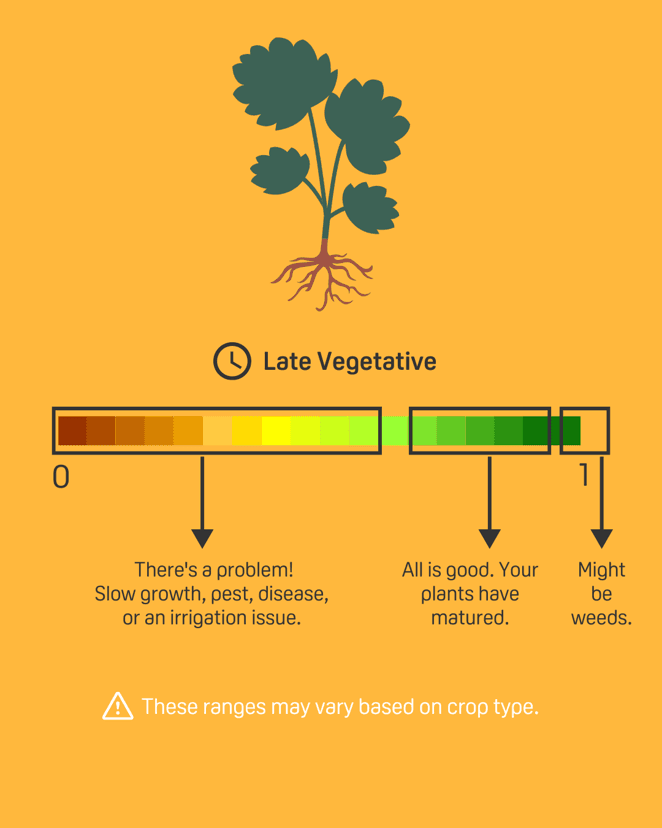
Late Vegetative
The late vegetative stage is marked by significant growth as plants increase in size, develop more complex root systems, and prepare for the reproductive phase. During this period, plants require ample nutrients and water to support their rapid development and biomass accumulation.
NDVI is particularly valuable in the late vegetative stage because it provides detailed insights into the canopy's health and vigor. High NDVI values indicate dense and healthy vegetation, suggesting that the plants are well-nourished and have a strong photosynthetic capacity. These areas are typically deep green, reflecting good plant health. However, it is important to note that extremely high NDVI values might demonstrate weed invasion in the field. On the other hand, lower NDVI values, appearing in lighter green or yellow, may reveal potential issues such as slow growth, nutrient deficiencies, water stress, or disease presence.
By analyzing NDVI data during the late vegetative stage, farmers can ensure optimal plant health in the late vegetative stage setting the foundation for successful flowering and fruiting. Stress or deficiencies during this phase can significantly impact yield quality and quantity.
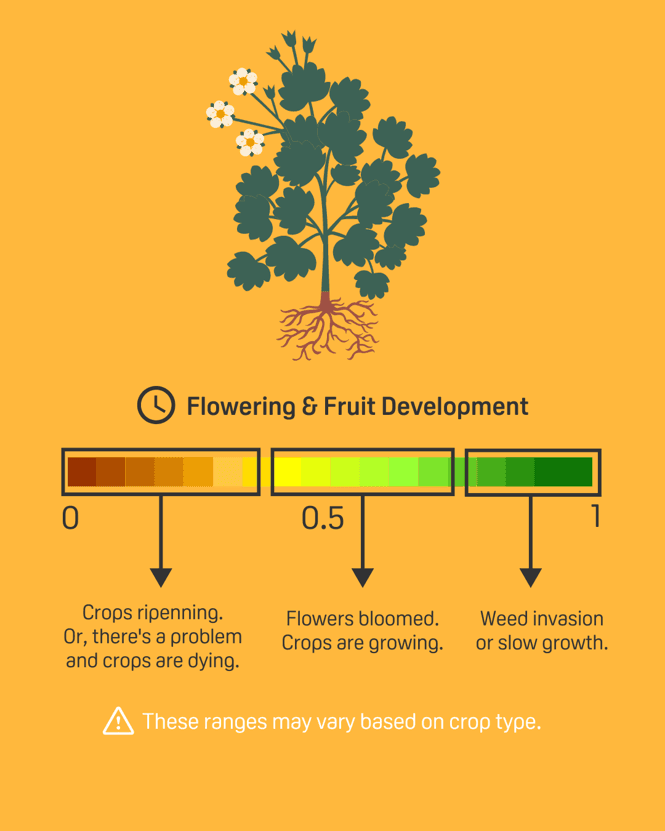
Flowering and Fruit Development
During the flowering and fruit development stages, crops are particularly sensitive to environmental conditions, and managing stress is crucial for ensuring optimal yield and quality. NDVI maps remain a vital tool in this phase, providing detailed insights into plant health that can significantly influence management practices.
Flowering Stage: In the flowering stage, plants are highly susceptible to stress from inadequate water, nutrient imbalances, and disease, which can adversely affect flower development and pollination. NDVI maps help identify areas of the field where the vegetation might be stressed or underperforming. Given that ideal NDVI values are represented in a right skewed distribution with the flowering season the desired descending begins. Therefore, mid-level NDVI values represented by light green indicate the healthy growth of the crop.
Fruit Development Stage: In the fruit development stage, similar to the flowering stage, it is common to see a decrease in NDVI values as the plant diverts resources to fruit production rather than foliage growth. Therefore, unusually high NDVI readings during this stage could indicate the presence of weeds or that the fruit growth is unusually slow, and the plant is maintaining more foliage than typical.
By leveraging NDVI technology during the flowering and fruit development stages, farmers can implement precision agriculture techniques that not only enhance crop yields but also improve the quality of the produce, aligning with market demands and consumer preferences.
Ripening and pre-harvest
During the ripening and pre-harvest stages of crop development, precise management becomes even more crucial as the final qualities and yield of the crop are largely determined in these phases. NDVI maps are invaluable tools during these stages, providing detailed insights into the health and maturity of the crop, which are essential for optimizing harvest timing and ensuring maximum quality and yield.
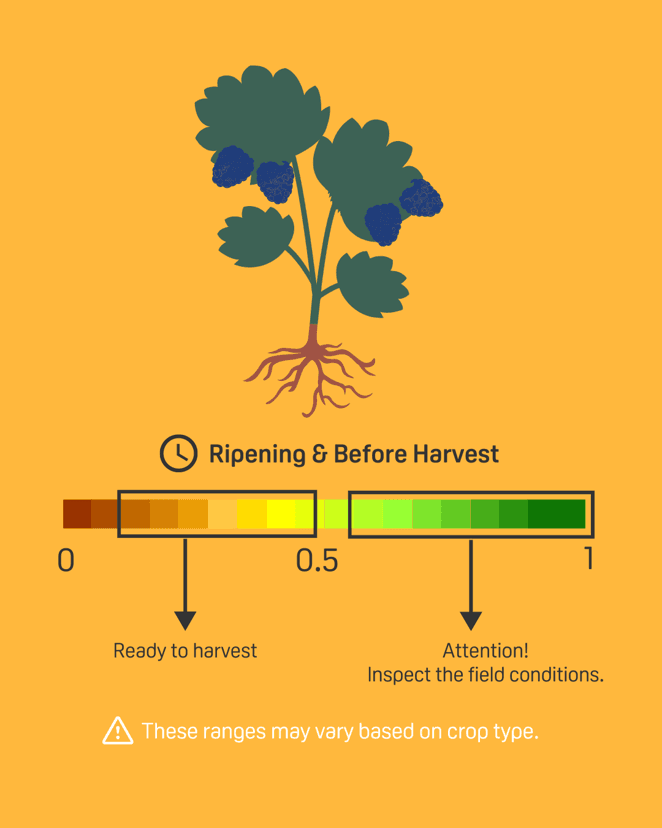
Ripening Stage: The ripening stage is critical as the fruits or grains undergo significant physiological changes, including color change, sugar accumulation, and softening in some cases. Healthy, uniform ripening is key to achieving high-quality produce. Collecting consecutive NDVI values is crucial in understanding how crops behave. Consistently lowering NDVI readings across a field suggests that the crop is ripening uniformly, which is ideal. In contrast, varying NDVI values can signal uneven ripening, potentially due to differential water or nutrient distribution, which may necessitate targeted management interventions.
To put it differently, NDVI value decreases towards harvest, so does vegetation. However, when the vegetation is too low, there is also a possibility that the crops are dying. Therefore, predictions can be made based on how the plant behaves in that season. It can also be compared with a natural image.
Pre-Harvest Stage: As the crop nears harvest, monitoring through NDVI maps helps in making critical decisions regarding the timing of the harvest. Accurate NDVI readings can help determine the optimal harvest time by showing when the majority of the crop has reached its peak physiological maturity. This is crucial for maximizing both yield and quality. Although lowering NDVI values is desired with the growth and ripening of the crops, extremely low values at this stage might indicate that certain areas are experiencing extreme stress or have already matured and are beginning to rot, suggesting that these areas should be prioritized for earlier harvesting to prevent losses due to over-ripening or decay.
Overall, NDVI technology during the ripening and pre-harvest stages supports strategic decision-making that enhances crop value, optimizes labor and resource use, and ensures the highest quality of produce is achieved at harvest.
Significance of NDVI:
Interpreting NDVI maps is a dynamic skill that improves with practice and expertise. While these maps provide valuable insights into crop health and land management, they can sometimes be complex. If you find yourself uncertain about interpreting your NDVI data, do not hesitate to get in touch with our expert agronomists. Our team is available 24/7 to answer your questions and guide you through understanding your NDVI maps to make the most informed agricultural decisions.
Resource Allocation: NDVI data helps in optimizing the allocation of water and nutrients during critical growth stages, ensuring that plants receive what they need precisely when they need it.
Stress Detection: Early detection of stress areas through NDVI can prevent potential yield losses by allowing timely management changes, such as adjusting irrigation schedules or applying foliar feeds or protective treatments against pests and diseases.
Harvest Optimization: By using NDVI data to monitor crop ripening and readiness for harvest, farmers can plan their harvesting operations more efficiently, reducing the risk of quality degradation or yield loss.
Input Reduction: Close to harvest, it's important to manage inputs carefully. NDVI can guide the reduction of water and nutrient applications at the right time to avoid wastage and potential negative impacts on quality (e.g., dilution of sugars in fruits).
Detect Variability Within Fields: NDVI helps in identifying intra-field variability, showing areas that may require different management practices. This can include adjusting irrigation levels or applying site-specific nutrient management to ensure uniform growth.
Quality Management and Assurance: Ensuring uniform ripeness across a field is key for marketability, especially for crops like fruits and vegetables where consumer appeal is directly linked to appearance and taste. NDVI maps can help identify areas that require specific interventions to improve uniformity.
For those keen on leveraging the latest in agritech to enhance your farming practices, we invite you to explore Doktar’s range of innovative solutions. Visit our website for comprehensive information on all our products, designed to empower farmers with the tools for precision agriculture. Stay connected and informed with the latest developments by following us on Instagram and LinkedIn. We regularly share insights, tips, and updates about our cutting-edge technologies and their transformative impact on modern farming.
Embrace the future of agriculture with Doktar, where we combine technology and expertise to help you achieve sustainable growth and improved yields.
Normalized Difference Vegetation Index (NDVI) is a crucial tool for analyzing plant health and optimizing agricultural productivity. Utilized globally across various agricultural applications, NDVI maps help farmers and agronomists monitor crop health, manage resources more efficiently, and enhance crop yields. By measuring and comparing the reflectance of near-infrared light, which healthy plants strongly reflect, against visible red light, which they absorb, NDVI provides a clear indicator of vegetation vigor and health.
In the realm of digital agriculture, Doktar leverages NDVI technology extensively through its innovative products, such as the Doktar App field scouting app and FieldFlow Farm Management System. These platforms use NDVI to identify areas of stress in crops, monitor growth stages, and optimize inputs like water and fertilizers, thereby supporting farmers in making data-driven decisions that lead to more sustainable farming practices and improved crop management.
Although NDVI maps have been crucial in following crop health and growth, reading them and turning colors into meaningful insight might be challenging. We have prepared this guide to protect our readers from falling into general misconceptions. Rather than generalizing that green is healthy and red is alarming, one should pay attention to the timeline between sowing/planting and harvesting while reading NDVI maps.
Plant establishment
In the early stage of plant establishment, successful germination and seedling survival are critical for the healthy development of crops. During this period, plants are particularly vulnerable and require optimal soil conditions, which can be closely monitored using NDVI maps. These maps provide valuable insights into the uniformity of plant emergence across a field, highlighting areas where growth may be uneven or delayed due to issues like soil compaction, moisture inconsistencies, or nutrient deficiencies.
To enhance the understanding of plant establishment through NDVI readings, it's important to observe the color gradients that indicate varying levels of plant health. For this period, the ideal expectation is a transition from red to yellow with an NDVI value closer to zero. Given that these are the early days for a crop to grow, high NDVI values may indicate either unbalanced growth between crops or weed invasion that is about to start or has already started. Addressing these discrepancies early on, by adjusting irrigation practices or redistributing nutrients, can lead to more uniform growth and ultimately, a more successful crop yield. This stage of analysis not only guides immediate agricultural interventions but also informs future preparatory measures for planting seasons.
Early Vegetative
During the early vegetative stage, plants begin to develop their first true leaves and start photosynthesis, which is crucial for their growth and development. This phase is critical as the plants are establishing their root systems and beginning to actively compete for light, nutrients, and water. NDVI maps are particularly useful in this stage for monitoring plant vigor and ensuring that the young crops are developing uniformly across the field.
The significance of NDVI during the early vegetative stage lies in its ability to provide a clear, visual representation of plant health and biomass accumulation. Tones from dark yellow to light green are the desirable ones on the map. While color tones closer to red (tones closer to value zero) might indicate developmental problems due to moisture, nutrient deficiencies, or disease, higher NDVI values (ranging towards one) indicating a more intense green color on the map might indicate weed invasion.
By using NDVI maps during the early vegetative stage, farmers and agronomists can make informed decisions about where to focus their efforts, whether it is to adjust irrigation systems, apply fertilizers, or implement pest and disease control measures. This targeted management helps in optimizing resource use and improving the overall efficiency of agricultural operations, setting the stage for robust plant growth and increased yield potential as the season progresses.
Late Vegetative
The late vegetative stage is marked by significant growth as plants increase in size, develop more complex root systems, and prepare for the reproductive phase. During this period, plants require ample nutrients and water to support their rapid development and biomass accumulation.
NDVI is particularly valuable in the late vegetative stage because it provides detailed insights into the canopy's health and vigor. High NDVI values indicate dense and healthy vegetation, suggesting that the plants are well-nourished and have a strong photosynthetic capacity. These areas are typically deep green, reflecting good plant health. However, it is important to note that extremely high NDVI values might demonstrate weed invasion in the field. On the other hand, lower NDVI values, appearing in lighter green or yellow, may reveal potential issues such as slow growth, nutrient deficiencies, water stress, or disease presence.
By analyzing NDVI data during the late vegetative stage, farmers can ensure optimal plant health in the late vegetative stage setting the foundation for successful flowering and fruiting. Stress or deficiencies during this phase can significantly impact yield quality and quantity.
Flowering and Fruit Development
During the flowering and fruit development stages, crops are particularly sensitive to environmental conditions, and managing stress is crucial for ensuring optimal yield and quality. NDVI maps remain a vital tool in this phase, providing detailed insights into plant health that can significantly influence management practices.
Flowering Stage: In the flowering stage, plants are highly susceptible to stress from inadequate water, nutrient imbalances, and disease, which can adversely affect flower development and pollination. NDVI maps help identify areas of the field where the vegetation might be stressed or underperforming. Given that ideal NDVI values are represented in a right skewed distribution with the flowering season the desired descending begins. Therefore, mid-level NDVI values represented by light green indicate the healthy growth of the crop.
Fruit Development Stage: In the fruit development stage, similar to the flowering stage, it is common to see a decrease in NDVI values as the plant diverts resources to fruit production rather than foliage growth. Therefore, unusually high NDVI readings during this stage could indicate the presence of weeds or that the fruit growth is unusually slow, and the plant is maintaining more foliage than typical.
By leveraging NDVI technology during the flowering and fruit development stages, farmers can implement precision agriculture techniques that not only enhance crop yields but also improve the quality of the produce, aligning with market demands and consumer preferences.
Ripening and pre-harvest
During the ripening and pre-harvest stages of crop development, precise management becomes even more crucial as the final qualities and yield of the crop are largely determined in these phases. NDVI maps are invaluable tools during these stages, providing detailed insights into the health and maturity of the crop, which are essential for optimizing harvest timing and ensuring maximum quality and yield.
Ripening Stage: The ripening stage is critical as the fruits or grains undergo significant physiological changes, including color change, sugar accumulation, and softening in some cases. Healthy, uniform ripening is key to achieving high-quality produce. Collecting consecutive NDVI values is crucial in understanding how crops behave. Consistently lowering NDVI readings across a field suggests that the crop is ripening uniformly, which is ideal. In contrast, varying NDVI values can signal uneven ripening, potentially due to differential water or nutrient distribution, which may necessitate targeted management interventions.
To put it differently, NDVI value decreases towards harvest, so does vegetation. However, when the vegetation is too low, there is also a possibility that the crops are dying. Therefore, predictions can be made based on how the plant behaves in that season. It can also be compared with a natural image.
Pre-Harvest Stage: As the crop nears harvest, monitoring through NDVI maps helps in making critical decisions regarding the timing of the harvest. Accurate NDVI readings can help determine the optimal harvest time by showing when the majority of the crop has reached its peak physiological maturity. This is crucial for maximizing both yield and quality. Although lowering NDVI values is desired with the growth and ripening of the crops, extremely low values at this stage might indicate that certain areas are experiencing extreme stress or have already matured and are beginning to rot, suggesting that these areas should be prioritized for earlier harvesting to prevent losses due to over-ripening or decay.
Overall, NDVI technology during the ripening and pre-harvest stages supports strategic decision-making that enhances crop value, optimizes labor and resource use, and ensures the highest quality of produce is achieved at harvest.
Significance of NDVI:
Interpreting NDVI maps is a dynamic skill that improves with practice and expertise. While these maps provide valuable insights into crop health and land management, they can sometimes be complex. If you find yourself uncertain about interpreting your NDVI data, do not hesitate to get in touch with our expert agronomists. Our team is available 24/7 to answer your questions and guide you through understanding your NDVI maps to make the most informed agricultural decisions.
Resource Allocation: NDVI data helps in optimizing the allocation of water and nutrients during critical growth stages, ensuring that plants receive what they need precisely when they need it.
Stress Detection: Early detection of stress areas through NDVI can prevent potential yield losses by allowing timely management changes, such as adjusting irrigation schedules or applying foliar feeds or protective treatments against pests and diseases.
Harvest Optimization: By using NDVI data to monitor crop ripening and readiness for harvest, farmers can plan their harvesting operations more efficiently, reducing the risk of quality degradation or yield loss.
Input Reduction: Close to harvest, it's important to manage inputs carefully. NDVI can guide the reduction of water and nutrient applications at the right time to avoid wastage and potential negative impacts on quality (e.g., dilution of sugars in fruits).
Detect Variability Within Fields: NDVI helps in identifying intra-field variability, showing areas that may require different management practices. This can include adjusting irrigation levels or applying site-specific nutrient management to ensure uniform growth.
Quality Management and Assurance: Ensuring uniform ripeness across a field is key for marketability, especially for crops like fruits and vegetables where consumer appeal is directly linked to appearance and taste. NDVI maps can help identify areas that require specific interventions to improve uniformity.
For those keen on leveraging the latest in agritech to enhance your farming practices, we invite you to explore Doktar’s range of innovative solutions. Visit our website for comprehensive information on all our products, designed to empower farmers with the tools for precision agriculture. Stay connected and informed with the latest developments by following us on Instagram and LinkedIn. We regularly share insights, tips, and updates about our cutting-edge technologies and their transformative impact on modern farming.
Embrace the future of agriculture with Doktar, where we combine technology and expertise to help you achieve sustainable growth and improved yields.


